Lithium-ion Battery Testing Chamber
Blog Post #8
Completed work for period March 23 - April 9:
Building off of receiving the testing chamber back from the UH machinist, the team worked to implement extra features such as ceramic fiber insulation and valve setup for the external gas bags. Furthermore, the measuring instruments and microcontroller were integrated into the testing chamber. Figure 1 shows the chamber when it was first retrieved from the machinist and Figures 2 - 4 shows various additions made to the chamber. Moreover, the interior walls are now lined with 1” thick insulation. The 0.3” passthrough holes now allow the thermocouples to pass through along with the gas sensor cable. On the left exterior of the chamber, the 1/4” ball valve connects to the 1/4” welded bung done by the machinist. To allow for the ball valve to be connected to the gas storage bags, a 1/4” hose barb is threaded to the end of the ball valve, allowing for a silicone hose to allow for the gas transfer between the chamber and the gas bags.
This concluded the milestone of creating a testing chamber prototype, however, a few problems persist that need a solution. One main problem is the sealing of the chamber since an observed gap is present between the chamber door and the interior of the walls that surround the door. The team knew this would occur which is why high density foam is being used to fill the gap. At the moment, the chamber has not achieved proper sealing, which is important to finish validation testing and overall provide an ample solution to containing the gas byproducts.


Figure 1: Initial Testing Chamber From the Machinist.
Figure 2: Ceramic Fiber Insulation and Thermocouples.
Figure 3: Gas Sensor and Thermocouples.
Figure 4: 1/4" Ball Valve and Hose Barb for Hose Connect.
Once additions were made to the prototype, the next step was to begin validation testing. The team began by doing the thermal insulation test and the lock reliability test. This allowed the team to test some of the additions such as the ceramic fiber insulation and the electromagnetic lock. Moreover, during these tests, the team also prepared for the validation tests that had not begun yet. These tests are the lock activation test and the leakage test. To conduct these tests, the chamber door will need to be properly sealed and the gas storage bags will need to be delivered.
Validation Results and Signs of Success
The team planned to conduct 4 different validation tests and currently, two of them have been conducted to validate how well the testing chamber functions. The two tests that have been conducted are the thermal insulation test and the lock reliability test.
The thermal insulation test consisted of heating the interior walls of the chamber with a 1000W heating coil and using an infrared thermal gun to check the exterior temperature of the chamber walls. The goal of this test is to ensure that the excess heat from thermal runaway does not allow for the exterior of the chamber to exceed 30 ℃. This temperature is slightly above room temperature, making it safe to touch. However, it should be noted that slightly higher temperatures than 30 ℃ are still safe to touch.
During the insulation test, the 1000W heating coil was able to produce a max temperature of 400.75 ℃. This temperature was recorded using one of the thermocouples included in the chamber. Furthermore, the heating coil was left in the chamber for an excessive amount of time at around 5-10 mins. This was because the heating coil needed a place to rest when not in use, making the insulated interior a good resting place for it. Moreover, exterior temperature measurements were taken at the center of each wall. Figures 5 and 6 show the recorded data from the insulation test and it can be seen that some of the walls will reach 30 ℃ and exceed it. The location that reached the highest temperature was the bottom which is expected since the battery will sit directly on top and was simulated using the heating coil. Other susceptible areas were the top of the chamber near the opening since the door was open during the test and the other area was the rear near the wire passthrough holes. This was due to the rear holes not being sealed, allowing for hot air to pass through.
Overall, the test provided promising results since the ambient temperature of thermal runaway will be around 300 ℃, meaning that every wall except for the bottom will have an exterior temperature of 30 ℃ or lower. However, the bottom wall can experience temperatures as high as 700 ℃ during thermal runway due to the battery sitting on this wall. Although the bottom wall did experience around 400 ℃ for an estimated 10 minutes, it could potentially see a higher exterior temperature than 42 ℃ if a 700 ℃ heat source sat on the wall. This means the team may need to add a thicker layer of insulation to the bottom of the chamber to further decrease the exterior temperature.


Figure 5: Inuslation Test Results Using a 1000 W Heating Coil.
Figure 6: Most Succeptible Areas for Heat Transfer.
For the lock reliability test, the experiment consisted of engaging the lock and pulling on the door with 400 N of force. The force was measured using the digital force gauge and the door displacement was measured using a digital indicator. Furthermore, the pulling forces were split into two categories, a gradual pulling force and a quick jerking force. To set up this experiment, the testing chamber was clamped to the table to prevent it from slipping and the force gauge was tied to the handle of the chamber using a rope. Unfortunately, even with the testing chamber clamped, it still showed slippage and would move when pulled. This caused problems when measuring the chamber door displacement since the whole chamber would move instead of the door opening slightly. Moreover, another problem the team faced was the max pulling force that could be accomplished. The team sought to achieve 400 N pulling force but this was near impossible and the highest the team could achieve was around 350 N.
Based on the test results shown in figures #-#, the door unfortunately opened at an average pulling force of 309.5 N. This force includes both gradual and jerk pulling force. Furthermore, when the door did not unlock, the average displacement was around 1.79 mm. This value is much higher than what was expected since the FEA showed that the door would experience a maximum displacement of less than 1 mm. Overall, the door unlocked at a rate of 57.14% when a jerk force was applied and opened at a much lower rate of 33.33% when a gradual force was applied. This was because the jerk force achieved an average pulling force of 302.57 N and the gradual force only achieved an average pulling force of 276.5 N. It can be concluded that a pulling force of around 300 N would open the door and a jerk pulling motion would lead to the most failures of the lock.


Figure 6: Lock Reliability Test Results Using a Gradual Pulling Force.
Figure 7: Lock Reliability Test Results Using a Jerk Pulling Force.


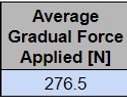

Figure 8: Average Gradual Pulling Force and Percentage of Disengagement.
Figure 9: Average Jerk Pulling Force and Percentage of Disengagement.
Improvements Needed and Future Work:
One major improvement that will be made to the testing chamber is the sealing. Seeing as experiencing zero to minimal leakage is a major constraint of this project, the team will work to ensure the chamber is not leaking gas with the use of foam strips. There are two remaining validation tests the team hopes to complete before the final report is due. The first is the leakage test which will consist of two parts. Part 1 of the leakage test will include the team placing a camera inside the chamber and a team member will shine a flashlight around the edges of the chamber. Then, the team will watch a playback of the video to see if the camera caught any light coming through. The team expects to see zero light passthrough, but if there is any light passthrough the team will automatically know that the chamber is not leakproof. The second part of the leakage test will consist of the team filling the chamber with 4 liters of helium gas. The team will measure the initial and final pressure inside the chamber using a pressure gauge. If the team witnesses a decrease in pressure, the team will know that the helium gas is leaking out over time and that the chamber is not leakproof.
The final remaining validation test is the lock activation test. The lock activation test will consist of the team sending a signal to the control system to engage the lock and the team will monitor if the lock activates. The team hopes to see that the lock engages properly 100% of the time. However, the team has already noticed that the lock struggles to engage autonomously. The team believes this may have to do with the lock’s alignment with the armature plate, and the foam strip sealing being in the way.